There is no intention on my part to provide Steve Keen any competition for his excellent Minsky program but I thought I would have a try to explain some of the economic ideas of this blog in figures rather than just in the usual words, so I put together this spreadsheet. Which you can download here. (Just make sure that it doesn’t get renamed when downloading. It needs to be called econ.xls for the macros to work). It is quite easy to use.

As spending has to come before taxation we first have to spend some money into the economy. I’ve chosen $500. Just consider the $ symbol to represent whatever currency you like of course.
The recipients of this money are three users of the currency (A, B and C) who receive the above amounts for services rendered. Just to keep it simple we only have these three users in the economy. The payments are decided in a quasi random way in the program so you won’t see the same figures but they should add up to the total spend by the government. Press the RESET button and you’ll see this.
Next, with the Tax level set at 0%, press the second macro button. You’ll see that user A uses his money to buy from user B. Then user B buys from user C and user C buys from user A.
As the tax level is set at 0% the goverment isn’t receiving any revenue so we now need to change this to 20%. Press the RESET.
Press the second macro and each time we’ll see the effect of a single transaction. ( meaning that all three users are buying and selling from each other). Notice that cash assets are equal to the government’s deficit and as the revenue rises the cash assets fall and the deficit falls too. Eventually the deficit falls to zero. We can raise tax rates to 30% or whatever and though the deficit falls faster it doesn’t go into surplus even with high tax rate. Press the RESET.
We’ll next allow our users to put some cash away in a savings account. We’ll allow them $5. As there are three users , pressing Macro button 3# should show $15. We repeat the exercise and surprise, surprise, no matter how many transactions we have, we end up with a deficit of $15.
Of course if I were George Osborne I’d shriek in horror at this $15 deficit
🙂 and call in the Office of Budget Responsibility. They would no doubt advise that the way to restore the spreadsheet to showing a surplus was to cut spending and raise taxes. So we cut spending to $450 and raise taxes to 25% and give the program another go. “That’s odd” George would be thinking “I’ve done what the OBR has advised but still my deficit is persistent!”
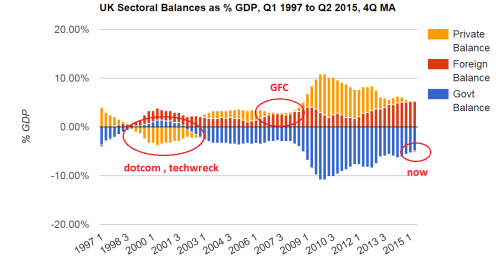
Next George could try Nigel Lawson. He knows a thing or two about producing a surplus. He managed it in the late 80’s by encouraging lots of borrowing. That’s what he’d suggest again. So George would type -$20 (minus $20) in the savings account for each user. Press macro #3 and try again. A few taps later on the second macro and Hey Presto! We have, or rather George now has his surplus. If we are one of those users, we are the ones in deficit!
If this wasn’t so serious and wasn’t ruining the lives of our young people this might be all rather amusing. How is it possible that such a cretin can be paid over £130,000 pa for f***ing up the economy?
………………….
Edit:
“Stuey” (below) asked an important question which might just bear repeating here with my answer.
Q: When I create a debt for the users, government runs a surplus. But isn’t that because the loan would have come from the government in the spreadsheet? Loans usually come from private banks. Doesn’t that make a difference?
A: It doesn’t make any real difference. We can easily put our three currency users into debt by clicking on the third macro.
Say we give them $100 worth of debt and the cash to match. That could be an overdraft at a private bank. So they’d have the debt but an extra $100 of cash ie spending money to start with. We click away on the second macro and the govt has a $100 surplus. Everything looks good – superficially.
If all the users banked at the same private bank the transactions would be recorded in the IOUs of that bank. Except, the tax bill on the transactions would have to be paid from the private bank’s reserves – in real central bank money.
So, at the end of the process, the users are collectively in debt to the tune of $100. The private bank has an asset of those debts but it has also lost assets of $100 from its reserve account. So the PB ends up all square. The debts in the economy remain, however, until they are repaid – unlike in the spreadsheet when they are extinguished by the reset button.
It is this accumulation of private debt in the economy which is the basis of Steve Keen’s debt deflation concept. The problem of increasing private debt levels can only be temporarily fixed by encouraging the creation of yet more private debt. But that’s a bit like a junkie needing a bigger and bigger fix. He needs at some point to choose a healthier lifestyle.
…………………….
PS I do this kind of database (usually Access) and spreadsheet programming in my day job too, usually in an engineering context. If you have any requirements send me an email: peter_martin_2001@hotmail.com


